![]()
![]()
Tutorial Page 4
![]()
An experiment is defined by moving through a series of forms which ask for input. You can move freely through these forms by clicking "Next" and "Back". The first form will look like this.
Here you are asked to choose a parameters and an environment file to be used for this simulation. Leave both as they are as there probably won't be any other files to choose from at the moment. All you have to do is enter a name under which the generated Excel workbook will be saved. This can be any legal file name and you don't need to add the ".xls" extension.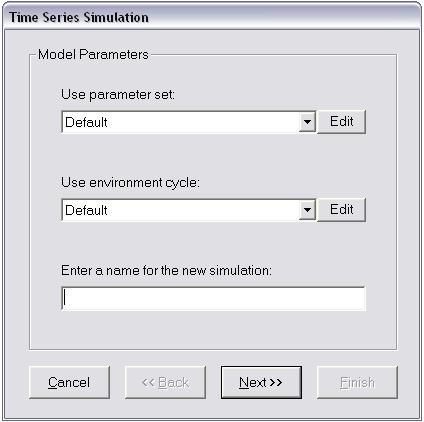
Click Next to bring up a form which we'll look at later. Ignore it for now and click Next again to bring up this form.
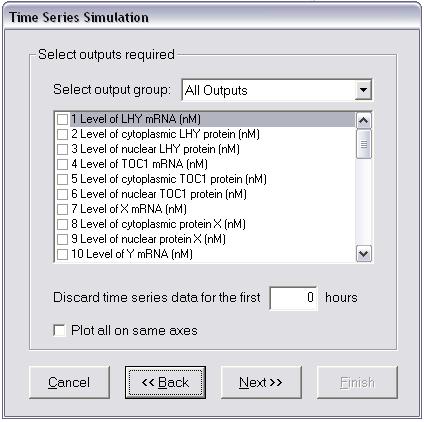
Here you are asked to choose which model outputs you are interested in. Those selected will be imported into Excel and plotted against time. Select " 3 Level of nuclear LHY protein" and "6 Level of nuclear TOC1 protein". Also, check the "Plot all on same axes" box. This will produce a single plot of both proteins, making them easier to compare.
Click Next to bring up the Integration form.
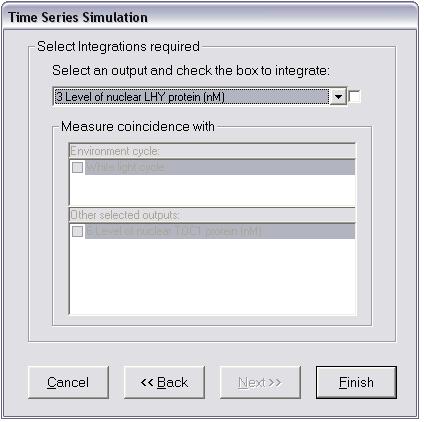
Integration allows us to measure the area under a time series curve over specified blocks of time. This is useful in calculating mean protein levels over these time blocks and coincidence between proteins and light or darkness.
This time we will measure the coincidence between TOC1 protein and light and dark. The drop down list will contain all the model states that were selected as outputs on the previous form. Change the drop down list to TOC1 and check the box next to it. This switches on integration of the selected output. The lists below should then become activated. Check the "White light cycle" box to choose to divide the time blocks for integration up by day and night.
- That's all the information required. Just click "Finish" to launch the simulation and wait for it to complete.