![]()
![]()
Tutorial Page 8
![]()
A fluence response experiment involves letting an organism free run under constant conditions of varying light intensity and comparing the free running cycle period under the different intensities. Therefore we need to run multiple time series simulations, produce some sort of summary table showing the effect of intensity on period, and also plot corresponding outputs on the same axes.
The first thing we need to do is create an environment file of LL. Click the "Environment" tab on the main window and open the default environment file. Set the "On" time to zero and "Off" time to "24". When these values are entered the black and white bar should turn all white (assuming the cycle period is set to 24 hours. Set it if it is not). Save this file as "LL" and then close the dialogue box.
One way of running this experiment is to click the
Experiments->Time
  Series->Compare Simulations->Vary Parameters Freely
menu item. This will produce a dialogue box asking you to select parameters and environment files and enter a name for your simulation. Make sure the environment file is set to "LL", enter a name and click "Next". Again we'll ignore the form which appears for now. Just click "Next" again.
In this module we are saying that we want to run the same simulation with the same environment and parameters files a number of times. We are given the opportunity though to vary any of the values in these files between runs, in order to see what effect this will have on the output. This form allows us just to choose which parameters we want to vary.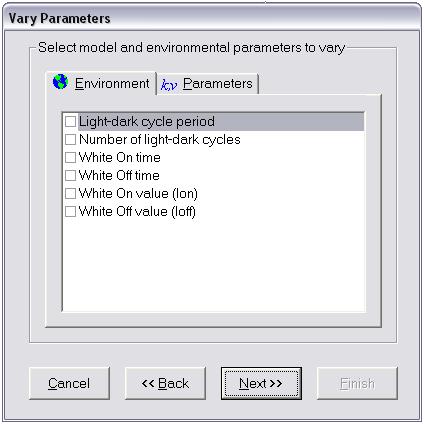
We are interested in the brightness of the light. Select the "Environment" tab to view the parameters defined in the environment file. Check the box next to "White On value (Ion)" and click "Next".
This form will appear.
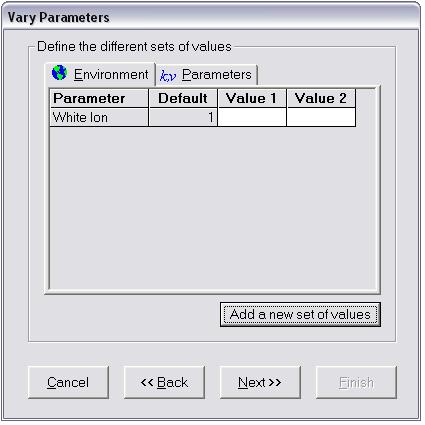
Here you are asked to define the values that each of the selected parameters will take on each run. We selected only one so we have only one appearing in the data grid. The value in column "Default" is the value in the selected environment file. This value will be used in every run unless it is overridden in this form. You can do this by entering values in the Value columns.
First enter zero for Value 1 and "0.5" for Value 2. We would like more repeats than this so click "Add a new set of values" to add another column to the grid. Do this twice more so we have five Value columns. We will therefore repeat this simulation five times.
Enter "1" for Value 3. In fact you could leave this box empty as it is the same as the default value. Enter "2" for Value 4 and "3" for Value 5.
Click Next to bring up a form we will ignore for now. Click Next again to bring up this form.
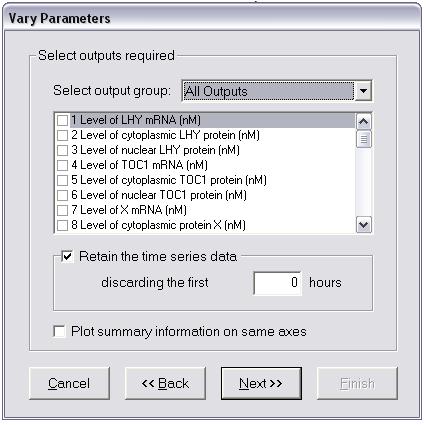
Here we are asked to select the model outputs we are interested in analysing. Check "4 Level of TOC1 mRNA".
Ensure the "Retain the time series data" box is checked and click Next.
- You will now see the integration dialogue box again. Check the box next to the drop down list to integrate the output. We won't bother checking the "White light cycle" box this time as the cycle is constant. TOC1 will be integrated in time blocks of one free running cycle period.
- Thats all the information required. Just click "Finish" to launch the simulation and wait for it to complete.