![]()
![]()
Tutorial Page 13
![]()
The simulation will probably take around 30 seconds, depending on the speed of your computer. When this is complete, launch the results workbook.
The first worksheet in the book is again called "Title". This will list the contents of the parameters and environment file, and the perturbation times.
The next worksheet is called "Environment". This contains the time series for the light dark cycle. Note that there are no ZT times this time. This is because the entire simulation was DD so there was no reference for ZT0.
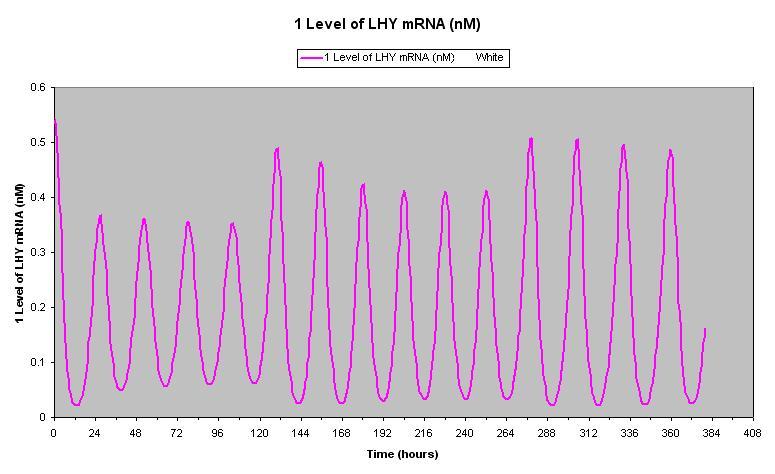
Next is the chart of LHY mRNA values, "Chart - cLm". It should look something like this.
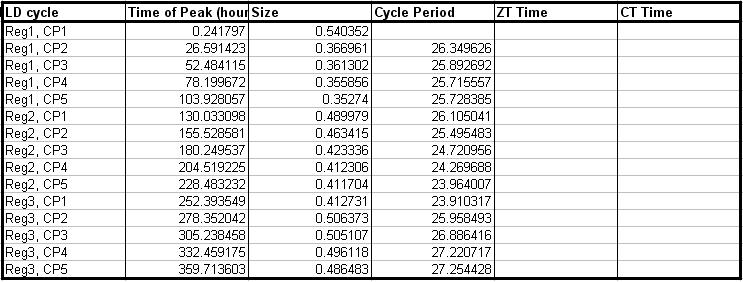
Next, the worksheet "cLm" contains the time series values and peak and trough time analysis.
Note that the free running period in regime one, before the perturbations are applied, is around 25.7 hours (peak at 104 hours). By the end of the second regime it is down to 24 hours (peak at 228 hours), due to the repeated pulses of TOC1 every 24 hours. By the end of regime three it is up to 27.2 hours (peak at 360 hours), due to the pulses being applied every 28 hours in this regime.
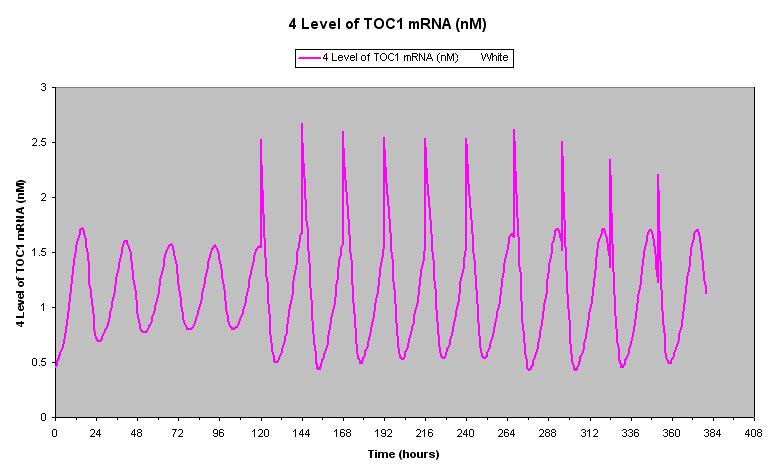
Next is a chart of the time series values for TOC1 that should look something like this.
Note the spikes when each perturbation is applied. The final worksheet "cTm" contains the time series values and peak and trough time analysis. This is less useful for cycle period analysis because the spike caused by the perturbation causes double peaks during each cycle period in regime three. It would require a small amount of editing of the data table to remove this problem.
That concludes this tutorial. If you think out software might be useful then why not download a copy.