[1] [1]
Tübingen, September 1999 1
5 Ultradian rhythms
5.1 Introduction
5.2 Chemical oscillator
5.2.1 Introduction
5.2.2 Background
5.2.3 Demonstration experiment
5.2.3.1 Instruction
5.2.3.2 Wave patterns of chemical activity
5.2.4 Experiment: Temperature dependence of the period length
5.2.4.1 Difficulties and sources of errors
5.3 Gravitropic pendulum
5.3.1 Background
5.3.2 Material
5.3.3 Induction of the gravitropic pendulum movement
5.3.4 Recording of the pendulum movement, graphical display and analysis
5.3.5 Proposals for experiments
5.4 Transpiration rhythm
5.4.1 Background
5.4.2 Material and recording method
5.4.2.1 Recording principle:
5.4.2.2 Cuvette
5.4.2.3 Humidity sensor
5.4.3 Setup of recording system
5.4.4 Recording
5.4.4.1 Experimental procedure
5.4.5 Analysis and graphical display
5.4.6 Proposals for experiments
5.5 Recording movements in Desmodium
5.5.1 Background
5.5.2 Observing the lateral leaflet movement
5.5.3 Experiment
5.5.3.1 Effect of LiCl on period length
6 Circadian rhythms in plants
6.1 Introduction
6.2 Leaf movement of Oxalis regnellii
6.2.1 Rearing the plants
6.2.2 Preparation for recording
6.2.3 Analysis
6.2.4 Experiments
6.2.4.1 Freerun
6.2.4.2 Anatomy of the pulvinus
6.2.4.3 Leaf movements in other plants
6.3 Flower clock Kalanchoe
6.3.1 Material and methods
6.3.2 Recording and analysis
6.3.3 Experiments
6.3.3.1 Effect of Li+ on Kalanchoe clock
6.3.3.2 Effect of the potassium channel blocker tetraethylammoniumchlorid on the petal movement of Kalanchoe
6.3.3.3 Turgor changes as the basis of the petal movement of Kalanchoe
6.3.3.4 Further proposals for experiments
7 Clocks in cells
7.1 The ancient clock of Thalassomyxa australis
7.1.1 Phenomon
7.1.2 Rearing, methods of observing
7.1.3 Proposals for experiments
7.1.3.1 Study 1: Synchronisation of Thalassomyxa australis
7.1.3.2 Study 2: Dependency of change in form from temperature in Thalassomyxa australis
7.1.3.3 Study 3: Synchronous culture of Thalassomyxa australis
7.1.3.4 Study 4: Do Thalassomyxa australis mutually influence each other in their rhythmic change of form?
8 Circadian rhythms in animals and man
8.1 Locomotor activity rhythms of animals and their analysis
8.1.1 Background
8.1.2 Animals, rearing, keeping
8.1.3 Recording of locomotor activity of animals
8.1.3.1 Set up and start of the recording system
8.1.3.2 Analysis
8.1.4 Examples and proposals for experiments
8.1.4.1 Activity rhythm of house flies under constant conditions
8.1.4.2 Locomotor activity rhythm of mutants of Drosophila melanogaster
8.1.4.3 Locomotor activity of syrian hamsters
8.2 Population rhythms
8.2.1 Introduction
8.2.2 Animals, rearing, maintaining
8.2.3 Recording of eclosion rhythm
8.3 Circadian rhythms in humans
8.3.1 Introduction
8.3.2 Material and Methods
8.3.3 Proposal for experiment
8.3.4 Planning and executing the experiment
8.3.4.1 Answering the questionnaire
8.3.4.2 Recording of rectal temperature and activity
8.3.4.3 Analyses of data
8.3.4.4 Statistics
8.3.4.5 Interpretation
8.3.4.6 Report
8.3.5 Significance, prospects and practical applications
8.3.6 Suggestions for independent experiments
8.3.7 Questionaire for the chronobio -logical phase type
9 Significance of circadian rhythms: Photoperiodism
9.1 Introduction
9.2 Experiments to induce flower formation
9.2.1 Rearing of plants
9.2.2 Determination of the critical dark period
9.2.3 Does the critical dark period depend on the temperature?
9.3 Photoperiodism in Drosophila litoralis
9.3.1 Rearing
Index
Glossary
Bibliography
5.1 Chemical oscillator
5.2 Belousov-Zhabotinsky reaction scheme
5.6 Stomatal apparatus
5.8 Oscillations of transpiration in oat leaf: Feedback loop
5.9 Oat seedling with primary leaf
5.3 Wave pattern of Belousov-Zhabotinsky reaction
5.4 Gravitropic pendulum
5.5 Gravitropic pendulum: curve
5.7 Rhythmic transpiration in oat
6.1 Kalanchoe-flowers
6.2 pH rhythm in CAM plants
6.4 Recording of Oxalis leaf movement
6.3 Oxalis cuvette
6.5 Anatomy of Oxalis pulvinus
6.6 Anatomy of Kalanchoe flower
6.7 Petal movement of Kalanchoe and osmotic pressure
6.8 Recording of Kalanchoe petal movement
6.9 Kalanchoe petal movement: curve
7.1 Synchronized Thalassomyxa culture
7.2 Thalassomyxa rhythmicity
8.1 Examples for day- and night active animals
8.2 Actogram of a housefly
8.3 Housefly
8.4 Recording system
8.5 fly cage
8.6 Recording the activity of Drosophila
8.8 Recording system for eclosion rhythm of Drosophila
8.7 Special forceps
8.9 Soot method for eclosion rhythm of Drosophila
8.10 Soot method for eclosion rhythm of Drosophila: Example of curves
8.12 Temperature course and sleep-wake periods of a person
8.11 Sleep-wake cycle of a baby
8.13 `Average day' of rectal temperature of a person
8.14 Circadian rhythm and chronobiological phase type
9.2 Critical darkperiod of Pharbitis
9.1 Flower buds and vegetative buds of Pharbitis nil
9.3 Exhaustor
1.2 Time of maxima, minima and points of deflection of the Desmo -dium lateral leaflet movement
1.3 Time and standard deviation (SD) of maxima, minima and points of inflection (PI) of the Desmo -dium lateral leaflet movement.
1.4 Table for recorded values of Desmodium motorium lateral leaflet movement.
8.1 Evaluation of the chronobiological phase type from the results of the netherlandic questionair.
8.2 Chronobiological phase type of different persons. xx
Overview:
Description of rhythmical events with periods in the minute and hour
-range. Examples are chemical reactions, reactions of seedlings after stimulation
by gravity, transpiration due to movements of stomata, and leaf movements brought
about by special joints.
Many biological oscillations are ultradian: The period length is shorter than circadian ones. Typically the period is in the minute- to hour- range. Chemical oscillations can serve as a model for this type of oscillations. The sequence of reactions in some of them are quite well known. They will be described in the next section.
In the third section of this chapter it will be shown how dark grown seedlings show pendulum-like oscillations after stimulation by gravity. Recording will be explained and experiments proposed.
The transpiration of grasses via their stomata can occur rhythmically, as reported in the fourth section. The water loss via the leaves is recorded and it is studied, how the oscillation depends on light intensity.
The lateral leaflets of the telegraph plant Desmodium motorium move relatively fast up- and down. These movements occur as the result of volume changes of motor cells in special joints. Recording of these movements and proposals for experiments are described in the fifth section.
As an example of a chemical oscillator the Belousov-Zhabotinsky-reaction is demonstrated. The temperature dependency of the period length should be determined. Besides oscillations in time this system exhibits also oscillations in space, which manifest themself as a pattern in chemical activity.
The rate of most chemical reactions depends on the temperature. We will therefore try to find out whether the period length of this chemical oscillator is also temperature dependent. We use the best known system, the Belousov-Zhabotinsky oscillator. This system shows also oscillations in space, which will be demonstrated.
For an introduction see [47,,]. The Belousov-Zhabotinsky-reaction was found by Belousov in 1958 and studied in detail by Zhabotinsky in 1964 [138].
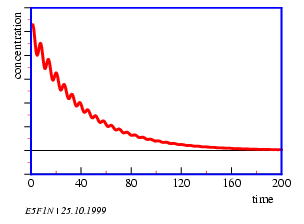
According to the laws of thermodynamics all spontaneous chemical changes in a homogeneous and closed system are paralleled by a decrease in free enthalpy of this system. Oscillations would therefore be impossible. However, under certain conditions the concentrations of intermediates can oscillate around the expected values of the stationary state when approaching equilibrium (figure 5.1).

Oscillations in time and space occur. A prerequisite is, that the system is not yet in an equilibrium and that it contains a feedback. The Belousov-Zhabotinsky-reaction consists of two main reactions A and B. They interact only marginally, because the reactions of A consist of ions and molecules with paired electron spins (singlets), and B consists of reactions of radicals. Whether A or B dominates, depends on the concentration of the Br- ions: If the concentration of Br- ions is high, A dominates, if the concentration of Br- is low, B dominates. A uses up Br- ; therefore reaction B is induced. B produces Br- ; therefore reaction A is induced (figure 5.2).
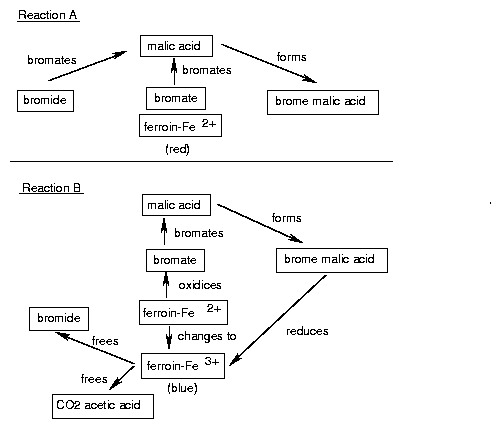
A: Bromide and bromate form together with malonic acid bromemalonic acid. The ferroin is first blue, due to the three valent iron (bromate oxidizes Fe2+ to Fe3+ ). However, due to bromate being removed, Fe2+ is formed and the ferroin turns red.
B: Brommalonate is concentrated enough to reduce Fe3+ to Fe2+ . Acetic acid, CO2 (gas bubbles!) and bromide are formed. The latter inhibits reaction A. This in turn inhibits the formation of brome malonate, and reaction B is inhibited. The cycle can start anew.
(A)(bromation of malonic acid)
2Br-+(BrO3)-+3H++3CH2(COOH)2® 3BrCH(COOH)2+H2O
(BrO3)-+4Ce3++CH2(COOH)2+5H+® 4Ce4++BrCH(COOH)2+3H2O
The rhythmic change in colour of the Belousov-Zhabotinsky oscillation is demonstrated in the following. The recipe of the necessary solutions are given and shown, how to observe the wave pattern of chemical activity. As an alternative, one of two movies can be shown which deal with chemical oscillators [64,].
The following four stock solutions are needed:
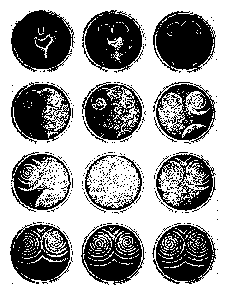
Pour the described solution in a clean plastic Petri dish (about 10 cm diameter) to a highth of 5 mm. A pattern of waves forms (figure 5.3). A trace of a detergent facilitates the wetting of the dish. The same chemical processes as described before are also responsible for the occurrance of these patterns. However, diffussion of the brome ions due to the lack of mixing plays now a role.
It should be determined, whether the period length (time between color changes from blue to red) depends on the temperature of the solution. This should help you to plan and execute a simple experiment. Therefore only some general proposals are made here and some hints are given, how to obtain the necessary informations. It is advisable to work through the chapter `Scientific work'.
Use the following procedure:
After having determined the period length at the different temperatures the mean period length and the standard error are plotted against temperature in a diagram. Read in the glossary about the Arrhenius plot and transform the values correspondingly. Determine the Q10 -value and interprete the results. For the graphic display you can use a plot program. What one should take into account in writing a report is described on page pageref.
The system oscillates only at temperatures up to 400 C. At this temperature the oscillation stops after 3 minutes. At room temperature the oscillations can be followed for about 4.5 hours. The concentrations should be kept accurately except the KBrO3 concentration (can be varied to twice the amount) and the Ferroin-concentration (can be varied eightfold). Traces of chloride ions (for instance at the fingers) can inhibit the reaction.
Dark grown seedlings may show a pendulum movement after stimulation by gravity. They will be studied using the morning glory (Pharbitis nil). The oscillations will be recorded with a video recording system. The period length and latency time is analyzed as a function of environmental temperature and hypocotyl length using different programs.
Gravity is used by many plants as a reference for orientation in space: Shoots grow often opposite to, main roots in the direction of the gravity vector. The physiological mechanisms of the balance system of plants are neither on a cellular nor on a molecular basis understood. The same is true for the balance system of man and animals. Experiments in space have offered new possibilities to study the function of the balance system of man in the absence of gravity. This is also the case for plants [134,,72,,].
Bending movements controlled by gravity are found in almost all higher plants. Cereals which have been layed down by wind grow upward again. Seedlings of sunflowers, morning glory and other plants which have been horizontally placed do the same. The physiological basis of this gravitropic reaction has been reviewed by Volkmann und Sievers [128] and by Iversen [68]. The sedimentation of amyloplasts (organells with starch grains) leads to an asymmetrical distribution and a stimulation of the endoplasmic reticulum. How this occurs is not yet understood in detail. According to Pickard [104], however, gravity is supposed to influence cell structures as a whole and induce stress reactions which lead to the gravitropic reaction.
After gravitropic stimulation gradients of indolyl acetic acid (IAA), K+ and Ca2+ are formed [104,]. The intensity of the reaction depends on the strength and direction of the stimulus. Often the reaction to a geotropic stimulus occurs in form of a damped oscillation. There are, however, also endogenous, selfsustaining oscillations, e.g. in the case of pendulum movements. Such `circumnutations' of sunflower seedlings were modelled in 1967 by Israelsson and Johnsson [67]. According to the modell, the movement was completely dependent on gravity. However, a spacelab experiment in 1983 (spacelab 1) showed that under microgravity conditions oscillations were still occurring. They are, however, less regular [17]. Already Darwin [26] regarded circumnutations as autonomous movements, which occurred independent of external factors. A modell for the gravitropic pendulum must, therefore, assume the existence of an internal oscillator and an additional influence by gravity.
Seeds of the morning glory Pharbitis15 are treated for 45 minutes with concentrated H2SO4 in an Erlenmeyer flask and shaken once in a while (Attention! Danger of spatter). This treatment causes swelling of the seed husks. Pour acid in a sink filled with much water and add quickly much water to the seeds. The short, strong increase in temperature leads to a uniform germination of the seeds. Use running water over night to wash off the acid. Place a net on top of the beaker to prevent the seeds from floating off. On the next day the seeds are planted individually about 15 mm deep in sand in a plastic vial (2-3 cm diameter) and kept moist. At 30 - 320 C the seeds germinate after 20-30 hours. They are kept in green `safe light' (physiologically unaffective)16 until the hypocotyls are about 50-60 mm long. This takes at room temperature about 4 to 6 days.
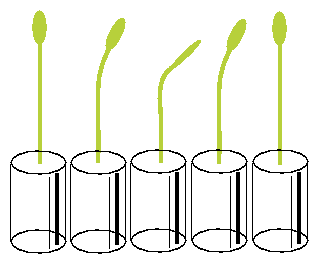
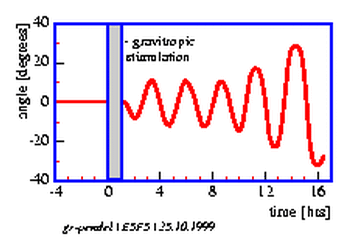
The vials with the seedlings are put into a horizontal position under safelight conditions for 20 minutes and brought back again in the vertical position. The seedlings start to bend after a latency period into the direction in which they would have grown if left horizontally. After some time bending in this direction comes to a halt, and the plants grow now in the opposite direction. Like a pendulum this oscillating movement continues for some time (see figure 5.4). The period length amounts to 20 minutes at 300 C [3].
Pictures of the hypocotyl are taken with a video camera and transferred to a computer equipped with a frame grabber. The position of the hypocotyl is determined by imaging analysis. The data are graphically displayed and analysed on the monitor screen (see figure 5.5). Function and use of the imaging system and the analysis programs are described in a handbook [37]. It is available on the internet [36]. The period length is determined by digital filtering. It has already been described in the first part.
Besides digital filtering other procedures can be used to analyse pendulum oscillations which have also been described in the first part of the book (periodogram analysis, maximum entropy spectral analysis, page pageref).
The transpiration of grasses via stomata may occur rhythmically. Water loss of the leaves is recorded and the dependency of the oscillation from the light intensity studied.
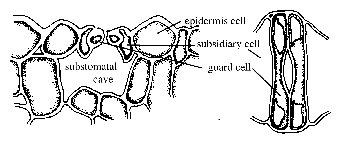
Land plants need CO2 from the air for photosynthesis. However, parallel to the uptake of CO2 water is lost, which might lead to difficulties in the water balance of the plant especially under dry conditions. Therefore during evolution special mechanisms were developed which help to solve the dilemma of a plant between hunger and thirst: A cuticula on the outer part of the epidermis cells which has a low permeability for water (and, unfortunately, at the same time for CO2 ), and special cell structures for the controlled uptake of CO2 and water transpiration, the stomata (figure 5.6).
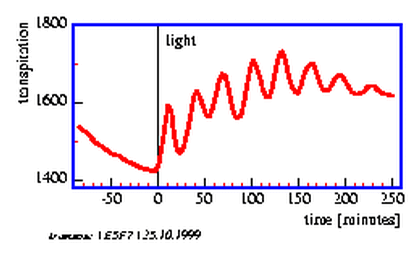
The transpiration of plants via the stomata depends on the light conditions, the water status, the CO2 -concentration in the leaf tissue, on temperature and other conditions. Opening and closing of the stomata occurs often rhythmically and synchronously in the entire plant, although the external conditions are kept constant. This results in oscillations of transpiration and of the water uptake in the roots (figure 5.7).
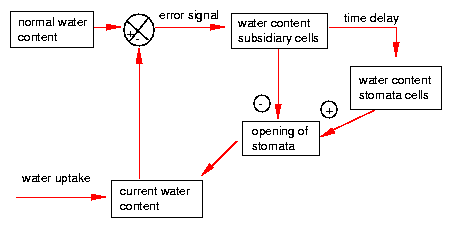
The control of the water state consists of several feedback loops. This allows oscillations to occur. Deviations from the normal water state change also the water conditions in the subsidiary cells and with some time delay in the guard cells. High water content of the guard cells induces opening, low water content closing of the stomata [25] [70](figure 5.8).
Ultradian rhythms in transpiration have been observed in grasses under certain conditions (see page pageref) [72][70]. To record transpiration we will use a humidity sensor. It monitors the humidity of the air after passing the oat seedling.
Rearing of oat seedlings: Oat grains are soaked over night on a sieve in a water container and brought to germinate. When the first leaf has ruptured the coleoptile (protecting sheath of the primary leaf) and has completely unfolded itself, a seedling is carefully removed with all its roots from the sieve. It is used for recording (figure 5.9).
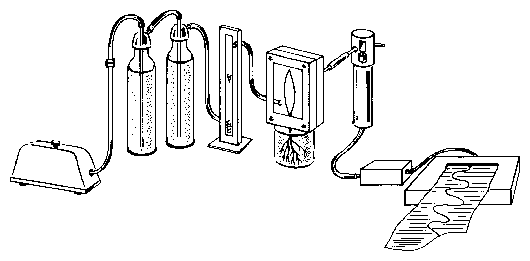
The leaf is mounted in a recording cuvette. Dry air is pumped through the cuvette with an aquarium pump. The air will be moistened by the plant to different degrees, depending on the amount of transpiration. The air passes a tube and reaches the humidity sensor. The electrical signal of the sensor is proportional to the humidity. It is amplified and recorded with a voltage recorder (figure 5.9). Alternatively the data can be brought directly to a computer via an A/D converter, stored and analyzed.
The cuvette is made of plexiglass as shown in figure 5.9. It consists of a front and back part, an entrance and exit tube for the air, and a small slit in the lower portion where the leaf is sealed with a mold17.
The humidity is measured with a humidity sensor (Vaisala, Finnland, see page 13.1.3). It consists of a condensor with a dielectric polymer between the condensor plates which is sensitive to humidity. Changes in humidity change the dielectric constant and therefore also the voltage between the condensor plates.
The cuvette to record transpiration is fixed to a support. The primary leaf of the plant is carefully inserted into the slit of the cuvette which had been filled with a mold. It seals the plant stem tightly from the outer air. The front cover of the cuvette is screwed to the back part with 4 bolds (see figure 5.9). Air is pumped through the cuvette by an aquarium pump via tubes through washing bottles. They are filled with dry (blue) silica gel. A flow meter just before the cuvette controls the air flow. Leaving the cuvette the air reaches the humidity sensor via a tube. The stalk of the sensor contains a converter, which produces an electrical signal. This is amplified and recorded by a voltage recorder. The plant in the cuvette is illuminated by a slide projector. Changing the distance and/or inserting grey filters allows to adjust the light intensity.
Getting started for recording
Setup of recorder
In order to analyse the data by digital filtering or another time series analysis procedure, the data have to be entered by hand from the recording paper to a computer. A more convenient way is to digitize the data with an A/D converter and to transfer the data to a computer. The curve can also be scanned and converted into data with a special program (e.g. Scandata). Plot programs (e.g. Techplot) are used to display the data as a function of time and time series analysis programs to determine the period length.
Alternatively, the position of the pointer of a voltage recording instrument is determined by imaging [37] as a function of time.
Besides the digital filter procedure other programs are available for the analysis of the transpiration rhythm. They have been described already in the first part of the book (page pageref).
The telegraph plant Desmodium motorium shows a fast up- and down-movement of the lateral leaflets. They are based on volume changes of motor cells in special joins. This rhythm is recorded with an imaging system .
Most people are not aware of the fact, that quite a number of higher plants display active movements. If corn has been laid down by wind or rain, it soon begins to grow upward again. But leaves can move too, as can easily be seen in Leguminosae: bean plants, peas, clover and Robinia bring during the night the leaves or leaflets in a vertical position, during the day they are horizontal. The movement is too slow to be recognized at once. But comparing plants in the day and night position shows the difference very clearly. In some plants much faster movements are found which are more obvious. The best known example is the rapid closing of the leaflets of the sensitive plant Mimosa. Not less obvious, but less well known is the up- and down movement of the lateral leaflets of Desmodium motorium, the Indian telegraph plant.
The lateral leaflets of Desmodium motorium show vertical or circular movements. This plant is therefore called `Telegraph plant' in India, because the leaflets seem to send messages between each other. Watch this movement carefully (figure 1.5). These movements will be used to practice the analysis and interpretation of data. We will record this movement with an imaging system (see page pageref). To analyse the data we use a program for digital filtering (see page pageref). How such a curve looks like is shown in figure 1.6.
Lithium ions slow down many circadian rhythms. We try to find out whether this applies also to the ultradian rhythm of Desmodium motorium. How would you carry out the experiment? Which concentration would you use, how long would you record, what kind of controls would you run?
Overview:
Circadian (daily) rhythms are widespread among higher plants. As an example
we will study the leaflet movements of Oxalis regnellii and the petal
movements of Kalanchoe blossfeldiana. The movements are recorded with
a video camera and a computer. Period length can be determined using special
analysis programs. Other rhythmic events in plants (fragrancy rhythm, acid metabolism)
are mentioned.
One of the most obvious daily rhythms in plants was described already by Androsthenes on the march to India with Alexander the Great: The leaflets of Tamarindus indica are folded together during the night and spread out horizontally during the day. These nyctinastic movements are widespread not only among the Fabaceae, but also in other plant families such as Oxalidaceae and Maranthaceae. The movements are brought about by turgor changes in special joints called pulvini (singular: pulvinus) . In other cases such as tomatoes and other Solanaceae or in cotton, Arabidopsis, movement is caused by alternating growth of the upper and lower part of the leaves [58,]. In Madurai (South India) 62 plants of a small botanical garden have been observed to show leaf movements (Chandrashekaran, unpublished).
There are several hypotheses trying to explain the significance of these nyctinastic leaf movements. According to Darwin [27] the heat loss to the surrounding is reduced in cool nights, if the leaves are in a vertical rather then a horizontal position (see also [43]). According to Bünning and Moser [] the vertical position reduces the amount of moon light absorbed. This prevents the plant from reacting photoperiodically at the wrong time of the year (for the significance of photoperiodism see page pageref). According to Karve et al. [76] the Fabaceae are able to grow very close together because of their nitrogen fixation capability. However, the resulting dense canopy of the leaves would not allow sufficient red light to reach the axels of the leaves in the evening and morning. This is, however, necessary for the induction of flowers. The vertical position of the leaves in the morning and evening would solve this problem.
Some flowers show also daily movements, such as the Crassulacean plant Kalanchoe blossfeldiana from Madagaskar (figure 6.1). Recording and experiments are described in this chapter. Other flowers show a conspicious fragrancy rhythm, such as Cestrum nocturnum (strongest odour during the night) or Exaccum affine (strongest odour in the early afternoon) (figure 1.2) [2,,].
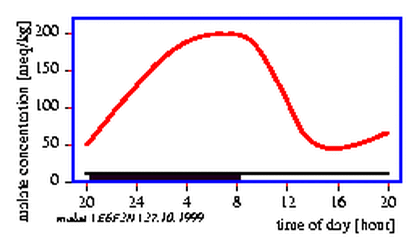
The metabolism of plants is also often controlled by a circadian clock. The CAM (Crassulacean Acid Metabolism) in Crassulacea acidifies the cell vacuoles during the night and alkalizes it during the day (figure 6.2) [79].
Under constant conditions these rhythms continue. However, the rhythm is now not any longer exactly 24 hours, but circa 24 hours, in the case of Kalanchoe for instance 22 hours. This is a clear indication, that these periodic events are controlled by a circadian clock. Such movements are easily observable and we will use again for automatic recording an imaging system (figure 2.1).
These rhythms can be influenced by light-, temperature-, and chemical pulses. From the results of these experiments conclusions can be drawn concerning the underlying mechanism.
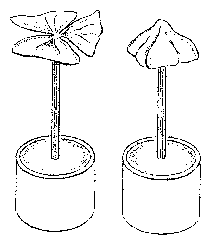
To demonstrate circadian leaf movements we use the leaves of the south American wood sorrel Oxalis regnellii. The threeparted leaflets are folded together during the night and are downward directed. During the day they are spread out horizontally (figure 6.3).
The plants are kept in many botanical gardens and easy to rear. The vegetative propagation from rhizom bulbs is the easiest. Put a bulb in a broad flower pot containing peath rich soil and keep well watered. The light intensity should not be too high. In case of diseases it helps to cut off all leaves. The plants start soon to develop new leaves.
The leaves are cut off the plant and the petiole put in a plastic straw which is mounted in the center of a polyurethan disk floating on water in a cuvette (figure 6.3).
With a video camera the cuvettes are recorded from above. The camera is connected via a framegrabber to a computer. With imaging software as described before (page pageref) the movements can be recorded and analysed. The setup for the recording is shown in figure 6.4. For illumination green fluorescence tubes (Philips TL 20W/15) are used. The optimal light intensity is 1.4 Wm-2 .

The data are displayed as a time series with a plot program (page pageref). Period length is determined by digital filtering or other analysis methods (page pageref).
A characteristic of circadian rhythms is that the periodic changes continue even under constant conditions. We record such a `freerun' (see next section). To understand the anatomical basis of leaf movements we make cross-sections through the pulvini and study them microscopically.
The leaves are cut at the end of a light-dark-cycle and mounted in cuvettes. They are then transferred into a recording chamber and exposed to continuous green light. Recording with an imaging system is started and run for 7 to 10 days. Every 20 minutes an image is taken.
The period lengths are determined by using adequate programs. Under continuous light the period length should not be exactly 24 hours anymore as was the case in a light-dark-cycle, but deviate from it. This proofs the circadian nature of this oscillation.
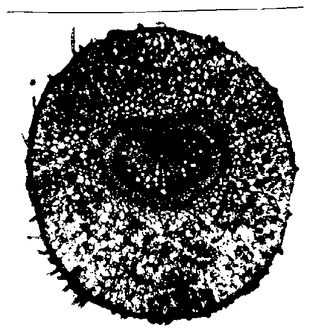
Cross sections through a pulvinus shows the structure and position of the motor cells (cells with large volumes) between the epidermis and the central core of phloem, xylem and strengthening tissue. In the leaf stalks, on the other hand, the conducting vessels and strengthening tissue are more at the periphery. Such a structure would not alow movement (figure 6.5).
You could study other plants with rhythmic leaf movements.
Proposals: Check different species of clover, bean, wood sorrel, Maranthaceae.
The petals of the flowers of the Crassulacea Kalanchoe blossfeldiana exhibit a diurnal movement. They are open during the day and closed during the night (figure 6.1).
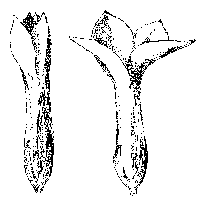
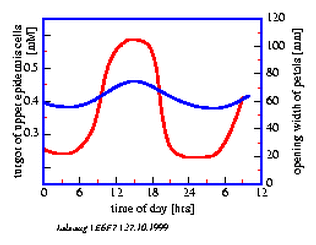
This rhythmic movement continues even during constant conditions of temperature and continuous weak green light. The time span from one maximal opening to the next is now, however, only 22 hours and not 24 hours. This movement is the result of a volume change of the upper epidermis and mesophyll cells (figure 6.6), which in itself is caused by changes in the osmotic value of the cell vacuoles (figure 6.7).
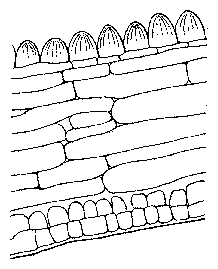
Plants are induced to flower by short day treatment (11 hours light, 13 hours darkness per day) for some months. After the flowers are formed and have started to open and close daily, they are transfered into a 12:12 hour light-dark-cycle (end of light for instance 10:00 in the morning) at e. g. 220 C. We record with an imaging system (page pageref). The flowers are broken off with a pair of forceps from the plant shortly before the end of the light period (in our case 10:00 o'clock) and mounted in a polyurethan plate (figure 6.8). The plate floats on top of a 0.2 molar succhrose solution in a rectangular plastic dish19.
The dishes with the flowers are illuminated from above by two green fluorescence tubes (Philips TL 40W/15). The tubes are covered with a green coloured foil (Cinemoid Foil Nr. 39, Strand Electric) and two grey foils (Cinemoid Folie Nr. 60). The light intensity at the level of the petals should be about 35 lux, because at higher intensities the rhythm of the petals is damped.
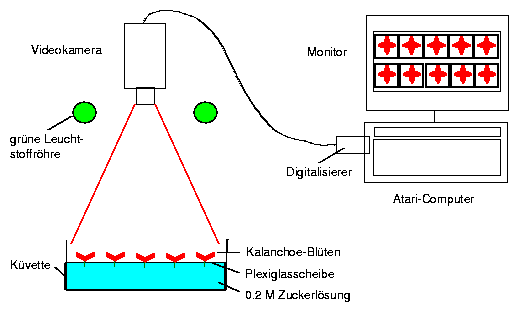
The imaging program is started on the computer. It is sufficient to sample images every hour for 7 days. Add daily some distilled water to the cuvettes to replace the lost water.
To analyse the results a time series analysis program such as digital filtering is used. It has been described before (page pageref). It filters the sampled data digitally and determines the period lengths of the petal movement rhythm of each individual flower (figure 6.9).
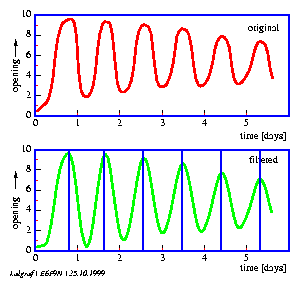
Calculate the mean of the periods of the individual flowers of the different groups and plot the results graphically.
Three experiments are proposed: In the first two the effect of Li+ -ions and of TEA (tetraethylammonium chloride, a potassium channel blocker) on the period length of the petal movement rhythm is studied. In the third experiment the turgor changes in the motor cells of the petals are determined. Turgor changes are the basis of the petal movement.
Kalanchoe-flowers can be used to study the effect of substances on the circadian rhythm. In this way the underlying mechanism might be better understood. A 5mM Li+ -solution for instance slows the clock by about 2 hours. Use 1 und 5 mM and a control, which contains only sugar solution. Li+ might work via the phosphoinositol-cycle.
Perform the experiment and evaluate it. Write a report of the results by using your protocoll (see page pageref).
During the leaf movement transport of ions through cell membranes plays an important role and K+ -channels are participating. Tetraethylammoniumchlorid (TEA) inhibits K+ -channels and can therefore be used to check, whether such channels are indeed parts of the rhythmic petal movement of Kalanchoe.
Use a control group (first cuvette) and three experimental groups with 0.5, 1 and 5 millimolar concentrations of TEA in 0.2 molar saccharose solution. Record for 7 days and analyse the data as described already. Plot the period lengths against the different concentrations used. Compare also other characteristics of the rhythmic movement such as damping and the opening width at the end of the experiment. What are your conclusions about the possible effect of TEA?
Read the article of Satter et al. [113], Ruge and Hampp [111] and Mayer and Hampp [91] on the basics and hypotheses of sleep movements in plants.
The red coloured upper epidermis of petals is peeled off with a fine pair of forceps. It is transferred into a mannitol solution (0.3 to 0.5 molar) on a microscope slide and covered with a cover slip. After 2 to 5 minutes the number of plasmolysed cells is determined under the microscope. This is repeated every 3 hours with epidermis pieces of other flowers. To avoid night work you can keep some of the plants 1 to 2 weeks before under an inverted 12:12 hour light-dark cycle. The 12 hour light period is during the night and darkness prevails during the day. In this way epidermis pieces of the normal and inverted groups which are observed for measurements are at each time physiologically 12 hours apart.
Quite a number of plants show a fragrancy rhythm of their flowers [2,,]. This is often an adaptation to the pollination by insects. Study different plants which are in blossom and try to find out how one can check for a rhythmic sensitivity of the human nose.
Overview:
Circadian rhythms are not only found in multicellular organisms, but also
in unicellulars and in cells of tissue and organs. Circadian rhythms have been
described lately even in prokaryots (in cyanobacteria). As an example for rhythms
in unicellulars the somewhat special case of Thalassomyxa australis is
presented. Here, in contrast to the normal circadian rhythms, the period length
depends on temperature and synchronization by zeitgeber is unusual.
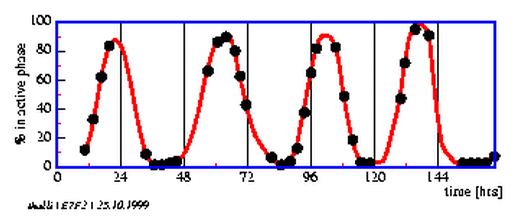
The marine naked amoeba Thalassomyxa australis was detected by Grell in 1983 at the west coast of Australia [55]. It changes its form between a round, inactive phase and a moving phase, in which plasmodial extrusions are formed, by which the animal moves around and takes up food (see movie [54]). The change between the inactive phase r and the active phase a occurs rhythmically and the period length depends, in contrast to normal circadian rhythms, on the temperature [122]. At temperatures of 20 0 C the animals spend about 2/3 of the time in the resting phase and 1/3 in the active phase. The period length is about 28 hours. As food organisms unicellular marine algae can be used. Amphiprora, the green alga Dunaliella and a marine Chlorella species are useful.
Look at the movie `The change in form of Thalassomyxa australis'. At the end of the movie a scene is shown in which concentric bands are formed. Play back this part and look at it again. Try to understand how these rings are formed and write down your ideas. How could one determine the time between two neighbouring rings of deposition? Do you know other rhythmic events which manifest themself in a similar way? Comment on it.
Thalassomyxa and food organisms are kept at the department of zoology at the university of Tübingen. The amoebae are reared in seawater at 20 0 C and in weak light in Petri dishes. Diatoms (Amphiprora) serve as food. Usually the diatoms divide fast enough and only rarely they have to be added to the culture. The cultures can, however, die out after some time. Renew the seawater in time or transfer the amoeba to new dishes by putting microscope slides in the dishes. Once the amoebae have settled to the new slides, they can be transferred to new dishes.
The animals can be observed under the microscope at 100* magnification. The inactive phase is readily distinguished from the active phase. If the dishes are checked every 2 to 3 hours, the changes in form can be recorded as a function of time (figure 7.2). With an imaging system ([36,]) the process can be recorded and reproduced as a time lapse movie.
Four experiments are proposed. They are described in the following. Use the hints that are given earlier in this book on how to plan experiments and to write protocols for experiments.
To synchronize biological clocks with the environment, `Zeitgeber' (time giver, time cues) are used. The most important Zeitgeber to synchronize circadian rhythms is the daily 24 hour change of light and dark. How would you try to find out whether the change in form in Thalassomyxa australis is synchronized by the light-dark-cycle? Do the experiment, evaluate the data and write a report (see page pageref). Which kind of other Zeitgeber could synchronize Thalassomyxa australis? How would you test your hypotheses?
Circadian rhythms as well as common clocks run at different temperatures of the environment at the same speed. Organisms in very constant environmental conditions such as some parts of the tropics or the sea with uniform water temperatures do not need to have temperature independent clocks. However, even under these circumstances the dependency of period length from temperature is low, although not quite as low as in organisms from higher latitudes of the earth with more pronounced daily and annual changes in temperature. Ultradian rhythms (period length in minute and hour-range), on the other hand, are usually strongly dependent on temperature (see the chapter Ultradian rhythms, page pagerefff.). There are, however, also temperature compensated ultradian rhythms known. How would you test whether the change of form in Thalassomyxa australis is, as other circadian rhythms, independent of the environmental temperature? Plan an experiment, execute it and analyse the results. Write a report (see page pageref).
If you want to study the biochemical and physiological processes during the change in form of Thalassomyxa australis, a method is needed to synchronize amoebae mutually. The first study has shown, that a light-dark-cycle does not synchronize the culture. There is, however, a very simple method to produce a synchronous culture. It is done by selecting amoebae in the same phase , which than stay in phase for many days because their period length is very similar (or because they mutually synchronize each other?20). The following method is recommend: Pour seawater out of a densely populated dish, drop a jet of seawater out of a pipette from 4 cm hights onto the amoebae on the bottom of the dish by spiraling the pipette over the whole dish. Shake vividly and pour all amoebae out which have lost contact to the surface of the dish (figure 7.1).
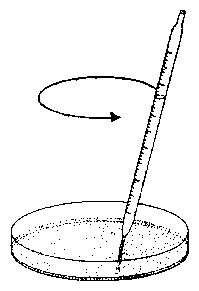
The animals which were washed off are the once in active phase. The animals in the resting phase are not detached from the dish by this treatment. Control under the microscope whether indeed all animals were washed off and repeat this procedure, if necessary. Add seawater to the dish, wait some hours and repeat the treatment. The amoebae collected then are all in a very similar phase, since they have gone from the resting phase into the active phase almost at the same time. They can be used as a synchronous culture .
If the collection of amoebae of the same phase is repeated after 12 hours, one can use the two cultures to test whether the cells are mutually influencing each other. Plan an experiment and the necessary evaluation, conduct it and write a report (see page pageref).
One can run also a computer model which simulates such a mixing experiment of amoebae in different phases with different numbers of amoebae at the begin. It is assumed that there is no mutual influence. An advantage of such a simulation is to get in a short time results of such different `experiments'. One can then look for those results which allow a clear decision. For instance, the optimal phase of the two cultures to be mixed and the number of cells in each can be found in this way. Intuitively one would probably mix a culture with a second one which is phase shifted by 1800 and would expect a new oscillation which results from the superposition of the oscillations of the two original cultures, and one would probably take equal amounts of amoebae from both cultures. If there is, however, a mutual influence of the two cultures, this combination is not recommendable, because the influence of culture 1 on 2 is the same as vice versa. It would be better to use a smaller number in e.g. culture 2 and to use a phase which differs from the phase of cultureone by 900 , because then culture 2 would after some time lock to culture 1.
Overview:
In this chapter locomotor activity rhythms are presented which are wide spread
among animals. They will be described with examples of house flies, fruitflies
(Drosophila), and syrian hamsters
. Recording methods
will be presented.
The eclosion rhythm of fruitflies out of the pupal case serves as an example for a rhythm observable only in a population.
Finally we will get to know the circadian rhythms of man and their practical significance.
The behaviour of most animals is controled in a diurnal way. Thus, flies are active during the day and rest at night, whereas it is the other way round in syrian hamsters. Drosophila pseudoobscura flies eclose mainly in the early morning hours out of their pupal case. In the late morning only few emerge and in the evening and night none. Those rhythms are not only widely found, but also easily recorded. We will use again an imaging system for recording (see pageref).
First we will mention briefly the background of circadian activity rhythms. Afterward we describe how to get or rear the animals needed and how to maintain them.
Secondly we describe, how the different activities are recorded and analysed. We will use the methods described already in the first part of the book (imaging system und light beam method).
On page pageref the construction of an air condition box is described. It can be used to keep temperature and illumination constant.
Finally different experiments are proposed. We refer to a handbook in which the recording methods are described in detail and for which programs and data are available which help to understand the procedures better [36]. With this book comes also a collection of activity data which can help to learn the analysis and the understanding of actograms.
Locomotor activity of many animals is adapted to the light dark cycle. Night active animals rest during the day, day active animals during the night. Examples for the former are cockroaches, owls and mice, examples for the latter flies, many birds, lizards (figure 8.1).
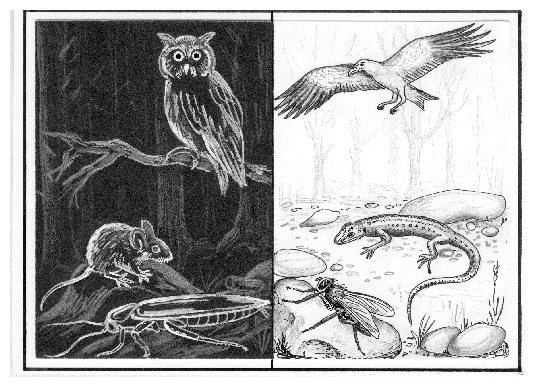
This daily change in activity and rest is continued in a room with continuous light and constant temperature and food and water available ad libidum. It looks like the animals are still able to notice the change between day and night. This could be explained in two ways. Either one or more environmental factors are still synchronizing the animals which we haven't been able to eliminate, or the animals use an internal clock which tells when to be active or when to rest. It is easy to decide between both possibilities. In the case of synchronization by an external (unknown) factor the rhythm of the animal should continue to be exactly 24 hours, whereas an internal clock is unlikely to run with exactly 24 hours. The observation of our animals shows: whereas in a 24 hour day with light dark cycles the animals became active or tired about the same time, they were, under conditions without time cues, each day somewhat earlier or later active, depending on the speed of their internal clock. From this we conclude, that the internal day of an animal is circa 24 hours (`circadian' from latin circa, about, and dies, day), although very precise for each individuum.
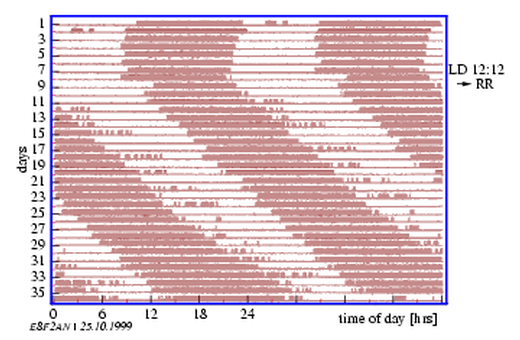
In figure 8.2 the locomotor activity of a housefly is shown. The animal was for 10 days in a light dark cycle and for another 30 days under constant conditions of weak red light and an environmental temperature of 22 0 throughout. This figure 8.2 is a so called actogram , a kind of black box of the fly (as used in trucks and air planes to trace the `activity' of the car or plain, respectively ): Activity is represented by vertical dashes, rest by a horizontal line. Time of day is shown on the vertical axis (from midnight to midnight), sequential days below. During the time of light dark cycles the animal became active with onset of light and stopped activity with the begin of darkness. When the change of light and darkness was discontinued, periods of high activity were still alternating with periods of rest. However, activity (and rest) began each day about 35 minutes later and stopped 35 minutes later. The day of this particular fly was therefore 24 hours and 35 minutes.
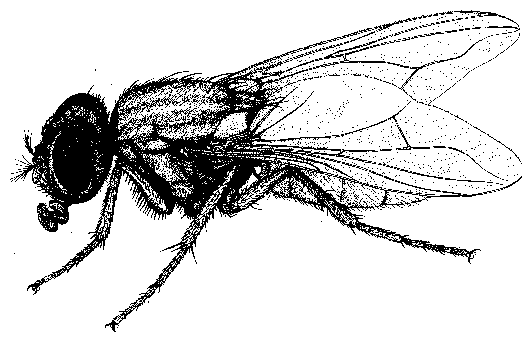
Musca domestica can easily be reared. However, since we need only a few flies and since they are usually found throughout the year in buildings, we will just give a reference only for rearing [131]. The identification of the species should be not difficult (figure 8.3) .
Drosophila melanogaster can be obtained from genetics departments or
purchased. During the summer and fall months they can easily be caught on fermenting
fruits
. Cultures can be reared
on food
which is prepared in the following way:
Measure
in the given order and stir when pooring the items into the warm water to prevent clumping. Boil for 5 minutes under constant stirring and add
poor while still hot in glass or plastic vials, close with foam stoppers and wait until cool. This food can be kept in the refrigerator for some weeks. A little bit of dry yeast should be added before flies are added [131]. Adult animals are transferred via a vial. They should have the same diameter of the opening. If the walls of the vial with food are wet, they should be dried with filter paper and/or a piece of filter paper should be put on the surface of the food before introducing the animals. Mark the vials (species, mutation, date) and rear the next generation in a 12:12 h light dark cycle at about 250 C. Larvae eclose from the eggs and feed on yeast growing in the food. Pupation occurs about 14 days later on the wall of the vials or on dry parts of the food.
Syrian hamsters can be purchased in zoo shops. There one gets also hamster cages which are already equipped with running wheels. Special hamster food can be bought, but corn or kitchen garbage are also sufficient.
Locomotor activity of animals can be recorded by different methods. Running wheels , tilting cages and photoelectric methods , in which the animal lives in a small container and interrupts a light beam when walking around, are examples. Here we use an imaging procedure for the recording of the locomotor activity of houseflies. This system has been mentioned already in the first part of this book2.1. The position of the animal in the cage is found out: Is it after a certain time interval still at the same place or has it moved? This recording is repeated for instance every 4 minutes and continued for several days. The results can be displayed on screen as an `actogram' and observed during recording. The data are stored in a file for later analysis.
For the recording of the locomotor activity of Drosophila-flies we use the system described in the first part of the book (page pageref).
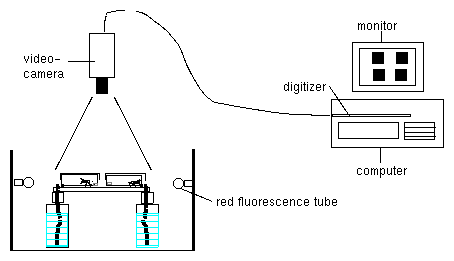
With the locomotor activity of houseflies as an example the setup of the recording system will be demonstrated (figure 8.4).
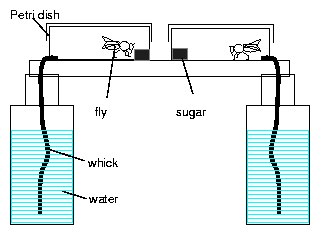
A hole (5mm diameter) is drilled in the bottom of a Petri dish of 10 cm diameter, through which a fly, head first, can be transferred into the container. A wick made of a strip of a kitchen cloth is inserted into the hole in such a way that it sucks water from a container and allows the fly to drink. A lump of sugar is fixed with plasticine to the Petri dish and serves as food. Several such cages are placed on a diffusing glass plate on top of red homogenous light22 (figure 8.5. The hole system is placed in the air conditioned box described already (page pageref).
The video camera is mounted on top of the air conditioned box. The camera lens is situated in a hole and looks upon the dishes with flies, which are housed in the box on top of the red light. A cable connects the camera with the framegrabber, which is inserted into a slot of the computer. For details see [36,].
For the time span between the single pictures (sampling rate) we could choose for instance 4 minutes, for the recording time e. g. 7 days.
With an analysis program described in part 1 the activity data obtained with the setup can be displayed as an actogram (figure 8.2) and the period length can be determined (page pageref).
Experiments to study locomotor activity rhythms of house flies , Drosophila and syrian hamsters are proposed in the following.
Houseflies are individually kept under 12:12 h light-dark-cycles for 7 to 10 days in the containers described before. They are than recorded for 7 to 10 days in red safe light. A change between activity and rest is still found under these constant conditions. However, the period length is not 24 hours any more as was the case in the 12:12 hour light-dark-cycles, but either somewhat shorter or longer (figure 8.2) [60].
A further experiment would be the demonstration of the temperature compensation of this free run rhythm. Independent of the (constant) environmental temperature (use between 18 and 350 C) the period length is almost the same.
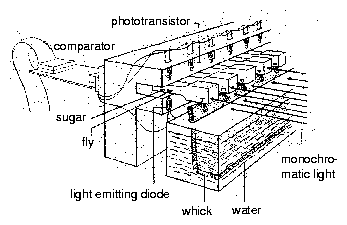
A number of mutants of Drosophila melanogaster are available with different period lengths. The best studied one are the per-mutants. This mutation affects eclosion rhythm and locomotor activity rhythm. per s has a shorter, per l a longer, and per 0 no rhythm. As an experiment it is proposed to compare the period lengths of these mutants with the one of the wild type. Since the Drosophila-flies are smaller then houseflies, the imaging system might pose problems. More suited is a light beam recording system which was especially developed for it. It was already described in the first part of the book. The recording cages are also different. We use plastic cuvettes as used for spectral photometers. Figure 8.6 shows the construction of a recording unit for flies. Individual flies are transferred into cuvettes containing a small piece of sugar and a wick for water supply. They are first recorded for a few days in a 12:12 hour light-dark cycle at constant temperature (e. g. 22 0 C). Afterward the recording of activity is continued under weak redlight. The activity pattern and the period length of the individual animals is determined and the mean value calculated.
Male syrian hamster are kept individually in cages. In females the circadian rhythm is less well expressed because it is superimposed by the sexual cycle. Water is supplied from bottles with a drink nipple, hamster pellets23 serve as food.
For recording, the imaging system can be used again. If the hamster is recognized while in the vicinity of the drink nipple, the food container and in the running wheel, drinking, feeding and running wheel turning can be detected separately (see [37]).
As an experiment the dependency of the circadian rhythm from the intensity of the (weak!) continuous light can be demonstrated []. The period length and the expression of the rhythm are determined for the different light intensities (e. g. 0.1, 1, 10 lux).
We record the eclosion rhythm of Drosophila pseudoobscura flies with an imaging system. The rhythms are analysed by digital filtering. Proposals for experiments with Drosophila and mutants are made.
With the imaging system we can not only record the activity of flies, but also the eclosion rhythm of Drosophila flies. This is a population rhythm, which can be observed only in a large number of animals [137]: The eclosion of a fly out of the puparium (pupal case) happens for the individual fly only once. That this event is also controlled by a circadian clock is shown by the behaviour of the population only: Eclosion is not evenly distributed over the day, but is concentrated to special times of the day. In a 12:12 hour light-dark cycle Drosophila pseudoobscura flies eclose a few hours after onset of the light period. In a subsequent continuous dark period (or continuous red light as physiological safe light) this eclosion rhythm continues.
Drosophila pseudoobscura can be obtained from genetics departments (e.g. University of Tübingen, Germany) or from Drosophila stock centers. This species lives in dry areas in the southern part of the United States. Drosophila pseudoobscura is reared in the same way as Drosophila melanogaster (page pageref). The development takes somewhat longer (at 200 C 21 days).
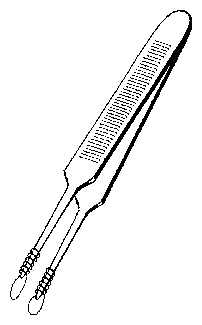
The pupae are inserted individually in holes with 3 mm diameter in a rectangular metal plate using a special pair of forceps (figure 8.7). A delicate white nylon net on the lower side of the plate prevents the pupae from falling through. A sooted slide ( 50*50 mm) is put on top of the metal plate24. Allow toxic substances to dissappear from the sooted glass plate by waiting for a night.
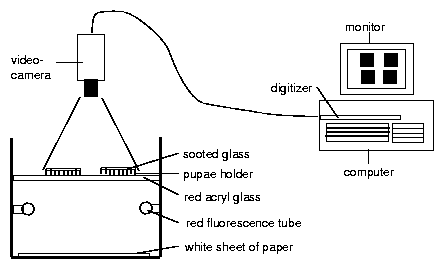
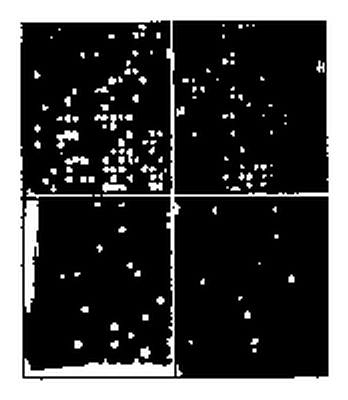
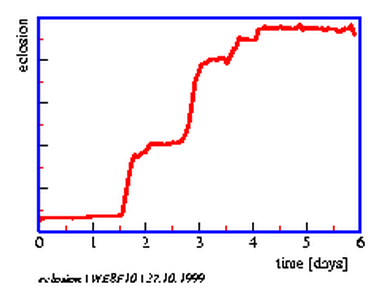
Underneath the metal plates is a red safelight25. As soon as the flies eclose from the puparium they try to free themself. In doing so they scrape off the soot on top of the hole. They die quickly and dessicate. Redlight can now pass through the hole (figure 8.9). A video-camera is mounted on top of an air conditioned box. The lens is inserted in a hole and sees the metal plates with the pupae in the box on top of the red light. The increase of the bright spots corresponds to the course of eclosion. The number of illuminated holes (eclosed flies) is recorded (figure 8.8) hourly with the imaging system described before. The data are stored on the computer (figure 8.10). If we record 3*3 = 9 metal plates (with 10*10 = 100 holes containing pupae), we obtain for 9 groups of 100 flies each the course of eclosion in step-like curves. They can be shown as diagrams during recording on the screen.
The setup of the system is described in the first part of this book and in a handbook [2.1].
Instructions to measure the diurnal rhythm of activity and body temperature of man and to find a possible correlation with the chronobiological type (morning-, indifference-, evening type).
On an average we sleep for about 8 h per day and stay awake for 16 h. This alternation of activity and rest is caused by an oscillator which functions even in the absence of external Zeitgeber such as light-dark cycles or social contacts [6,,].
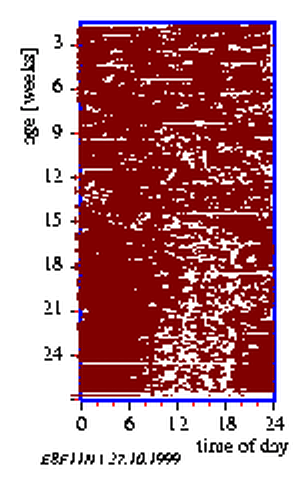
Humans staying in well-insulated isolation units or bunkers [132,] or inside caves [120] still continue to go to bed and awake on a near-daily basis thus experiencing subjective night and subjective day. Paralleling the sleep-wake cycles are the rhythms in the profiles of body temperature, urine output, concentration of ions in urine, bodily and psychological alertness [6,]. However, the period length of these rhythms, as for instance between successive maxima is not exactly 24 h any more as under normal day-night conditions. It is now typically 25 h or slightly more. This 25 h `free running rhythm' expresses itself in newborn human babies under natural day-night conditions, even though it is often punctuated by short term sleep-wakefulness cycles (figure 8.11). It is only after the lapse of the first few weeks that human babies entrain to the 24 h day-night duration of the outer world [78]. In the course of subsequent years in life humans develop tendencies to belong to 'early morning', 'late evening' or indifferent types [,].
We propose to conduct a test which will show to which phase type you belong. Besides you can record your own body temperature automatically and determine temperature maxima and minima in each cycle. We could expect that the 'morning' type of persons experience temperature minima to occur earlier in the night than do 'evening' type of persons. The locomotor activity could also be measured using special recording devices.
The test is conducted in the form of a questionnaire (see page pageref). For recording body temperature we use a portable instrument with a thermoprobe which is inserted into the rectum. The rectal temperature is recorded at certain time intervals and the data stored. The wrist movements can also be recorded using the same apparatus.
The filling up of the questionnaire should pose no problems. Follow the instructions. Table 8.1 shows the evaluation of the chronobiological phase type.
| chronobiological phase type | score |
| extreme evening type | 7-10 |
| weakly expressed evening type | 11-14 |
| indifference type | 15-21 |
| weakly expressed morning type | 22-25 |
| extreme morning type | 26-31 |
A few methodological hints may be in order at this juncture. A protective covering is pulled over the thermoprobe (e. g. the disposable protective covering for fever thermometers `steritemp'). The thermoprobe consists of polyvinyl chloride with a polyvinyl cable. Therefore no organic solvents such as alcohol, aceton etc. shall be used. Medical desinfectans should not act on it too long. The probe with cable should be slowly and gently inserted into the rectum about 6cm almost until the end of the protective covering (wetten or use some cream). The best way to do this is by laying on the back and spreading the legs. The cable from the probe to the instrument should not be tight, in order to prevent the cable from braking. Relieve the cable at the plug end by using a loop. The best way to carry the instrument is on the belt of the troucers.
The function and application of the recording device are described in the instructions of the maker. The apparatus has to be equipped with a new set of batteries. The data are transferred via an interface to a PC and displayed as a function of time on screen using special software supplied by the maker.
A log note-book should be available to enter time of rising, meal times, nature and time of activities during the day, special events, time of going to bed, time of falling asleep and wakeup.
Try to find out whether there is a correlation between the time of temperature minima and the classification of the 'morning-evening' types (which is obtained from the questionnaire). This would of course mean that your own experiment and data are only one brick in many, and that a series of experiments have to be performed on numerous persons, until a clear-cut answer can be found. For this very reason it is important to maintain a detailed description of procedures and entries which is intelligible also to others and to add your results to those collected by earlier workers. This explains why the experimental strategy has been explained at greater length than those for other experiments.
After answering all questions add up the sum of individual scores. The chronobiological phase type results from the following table . Add important data such as age, sex, profession, working time, structure of day.
Use the instructions coming with the recording devices and start recording.
Record rectal temperature and activity as described for at least a week continously. It is important to note down the exact time of wakefulness, rising from bed, meals, physical activities, drinks and their nature (especially alcohol, coffee, tea, cocoa), sitting, standing, movements, lying down, going to bed etc. It is recommended to make notes elaborately, which might be needed later to interprete the recorded data and their time course.
The results can be graphically presented after the data have been entered into the computer. With a special program body temperature and activity can be displayed on the monitor screen and printed on a printer. The data can be analyzed with analysis programs.
An example for such a temperature- and activity curve is shown in figure 8.12. A rough estimation of the period length can be made from the graph.
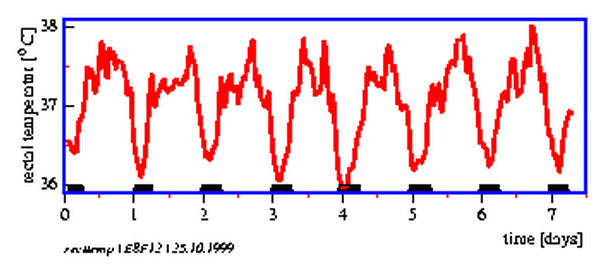
More precise is, however, the evaluation with a timeseries analysis procedure. They are described on page pageref. In order to transfer the data in this or in other programs they have to be transformed into a suitable form.
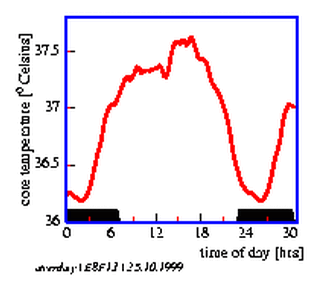
With a signal average methode an `average day' can be obtained (figure 8.13), from which the temperature minimum can be obtained. These values and the activity minimum are entered into the table 8.2 and into the graphic display (figure 8.14) below it.
| full name | prename | M/F | age | type | temp.min. |
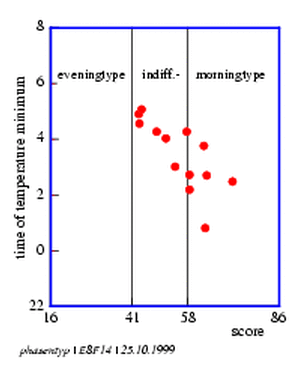
When sufficient data become available (from other persons) a correlation analysis should be undertaken. For this purpose enter the phase type score and the clock time at which the temperature minimum is found. The correlation coefficient r2 is calculated. Similarly r2 is calculated for a possible correlation between activity minima and the phase-type number. In case the data points do not permit a linear dependence of the phase-type from the time of temperature or acivity minima then other kinds of data fitting should be considered.
When data of at least 15 person are available the results should be interpreted. It is possible that there is no noticeable correlation between the chronobiological phase-types and temperature- respectively activity minima. It might be that inconsistencies occur in the data for only some persons. I.t would be of interest to look for personality traits and other factors that account for these deviations. In such instances it would be better to correlate the clear cases only and try to find simple criteria which would characterize the other `type'.
Report on the results and use also the results of other persons in order to answer the initial question (`Can chronobiological phase-types be correlated to the temperature and/or activity minima?' (page pageref) [77].
The experiment performed was supposed to answer the question whether the chronobiological phasetype, as indicated in the questionaire, was indeed related to the temperature and/or activity minima. In the case of evening phasetypes one could expect minima later in the sujective night and in the morning phasetypes earlier minima. These results are important in the context of shift work since it turns out that markedly morning phasetype persons are unsuited for night shift work [1,,] .
There might emerge other practical applications to these findings. There are indications that the chronobiological phasetypes may in some cases arise as a function of age and that fluctuations are found during the age children go to school . Unfortunately our society does hardly take any notice of these phenomena. In fact many traffic accidents involving school children might be avoided by adjusting school timing to suit the chronobiological behaviour traits of children. Obviously the alertness and performance skills of children are also very strongly correlated to the chronobiological phase types. This can be demonstrated easily by experiments. A vast array of experimental possibilities lies in this area of chronobiology. Someone remarked that more marriages might break up because of chronbiological phase incompatibilities of the partners than of other reasons. Watch out!
Besides body temperature and bodily activity several other physiological processes display a distinct circadian rhythmicity in humans. Those who wish to investigate a few of these are referred to Koukkari et al. [82]. Even body temperature and activity can be used to answer a series of other questions, as for example:
This list consists
of questions which relate to your activity and feeling of being awake in the
morning and evening. In answering questions 1 to 4 you should assume that
you have to work during the day for 8 hours at a selfselected time. Answer all
questions honestly. Place only one cross for each question.
How difficult would it be for you if you had to go to bed all times
at 01:00 o'clock?
How difficult would it be for you if you had to rise up in the morning all times at 06:00 o'clock?
Imagine you decided to participate in a fitness training. Your friend proposes an hours training twice a week. For her/him the best time in the morning would be from 7 to 8 o'clock. How would this be with you?
Imagine you decided to participate in a fitness training. Your friend proposes an hours training twice a week. For her/him the best time in the evening from 23 to 24 o'clock. How would this be with you?
Underline at which time you normally go to
bed.
Example:
¯20:00 ¯21:00 ¯22:00 ¯23:00¯24:00 ¯01:00 ¯02:00
¯03:00
20:00 21:00 22:00 23:00 24:00 01:00 02:00 03:00
Underline at which time you normally rise up
from bed.
¯05:00 ¯06:00 ¯07:00 ¯08:00 ¯09:00 ¯10:00 ¯11:00 ¯ 12:00
Are you a morning- or evening active person?
The evaluation of the questionaire is on page (siehe Seite pageref)
Overview:
Quite a number of organisms use daylength for photoperiodic reactions.
In this way they are able to adapt themself to changes in environmental conditions
during the course of a year. Experiments for photoperiodic reactions in Drosophila
flies and for flower induction in short day plants are described.
Organisms living in temperate or higher latitudes of the earth had to adapt themself to the seasonal changes of the environment. They mostly use the daylength as the most reliable indicator of the time of year. If in the fall the days become shorter, it signals that winter is coming and with it unfavorable life conditions. The organisms have than still time to prepare for it, by inducing a special behaviour (e. g. larvae crawl into the soil) or metabolic processes (for instance in insects protection of the body fluid against freezing).
There are numerous examples for photoperiodic reactions. In plants the daylength often determines whether flowers are formed. In plants of temperate or higher zones this occurs usually in long day (e. g. shooting of salad). But there are also short day plants found. In their case flowering is induced by short day. To them belongs the Crassulacea Kalanchoe blossfeldiana from arid areas of Madagaskar.
Many insects survive unfavorable conditions in the state of diapause. Diapause is also in most cases photoperiodically induced.
In mammals the colour of the fur can be controlled photoperiodically. The sibirian hamster is white in the winter and brown in the summer. Another example: The rutting season is induced by certain daylengths. For this and further examples see [8].
Photoperiodic reactions have an important practical significance in agriculture (chicken for instance lay eggs only in long day. By using additional light in the night egg is maintained also in the winter). Furthermore, in horticulture photoperiodic treatment is used to induce flower induction at certain times of the year when those plants would usually not flower.
Quite a number of plants can be induced to flower by short days. The morning glory Pharbitis nil is especially useful for demonstration, because in the strain `violett' a single short day is sufficient to induce the photoperiodic reaction. Furthermore this plant can be induced already in the seedling stage. It takes only a few days until the photoperiodic reaction is induced. This allows to conduct experiments in a short time.
Seeds can be purchased from the Maruthane Trading Company in Tokyo (Japan). They can be kept in the freezer for a few years. The seeds are treated with concentrated sulfuric acid (45 Minuten), the acid poored off (in much water, attention, never poor water in the concentrated acid, danger of splashing!) and much tapwater added to the seeds. They are heated for a short time which synchronizes germination. After 12 hours of watering in running tap water (with a net on top of the seeds to prevent the seeds from floating away) plant the seeds 15 mm deep in garden soil in pots and allow to germinate in continuous light.
After the cotyledons have unfolded themself the plants can be induced photoperiodically. A single darkperiod is sufficient in the strain `violett'. Afterward the plants are transferred again in continuous light. Vary the length of the dark period for groups of 10 plants between 6 and 20 hours.
Already one week after the dark treatment the condition of the buds can be determined under the binocular. Flower buds have two long bracts und a broad apex, whereas vegetative buds possess a pointed apex (figure 9.1).
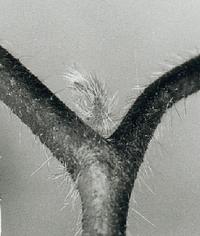
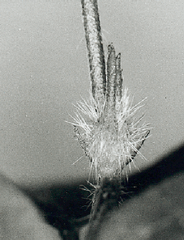
Determine the mean number of flowers per plant in each group. Plot the results against the length of the dark period. The critical dark period is the length where the plants show 50% of the maximally inducible flowers (figure 9.2).
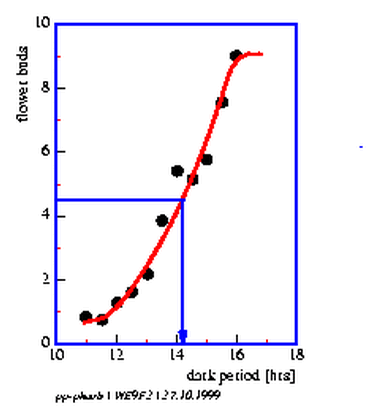
The experiments can be performed at another environmental temperature in order to test, whether the critical dark period is influenced by it. Remember that circadian rhythms are temperature compensated in their period length. According to Bünning[] the daylength measurement in photoperiodic reactions occurs with the help of the circadian clock. Accordingly the critical daylength should be independent of the environmental temperature.
In numerous insects developmental steps are photoperiodically controlled. Take the development of ovaries of female Drosophila litoralis as an example. It is blocked in short day. Cultures are kept at the department of genetics, SF 90570 Oula (Finland). There are various strains, the critical daylengths of which differ. Strain 1008 from the Tessin has no diapause (`Ticino'), strain 1036 has a critical daylength of 20 hours (`Oulu 1A'), im-3 (`Kutaissi'), and 1052 (`Batumi') of 12 hours. The further south the species is found, the shorter is the daylength at which ovary development is stopped.
Rear in 250 ml bottles. For oviposition to occur flies must be at least 2 weeks old. Wash the larvae out with water, bring them in small quantities in vials which have to be kept humid and supplied with yeast. Use cotton- or cellulose plugs. Food recipe see [85]. Nipagin prevents mold growth. At 19 to 20 0 C the development from oviposition to eclosion takes 3 weeks. Eclosion is spread over a week. Change food every fourth day, 100 flies per vial. Transfer flies with exhaustor (figure 9.3).
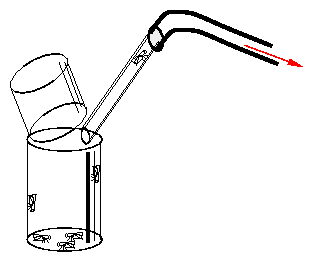
The adults are photoperiodically sensitive [85,]. After eclosion every second day flies are collected and transferred into different photoperiods at 16 0 C. For instance 6, 9, 12, 13.5, 15, 16.5, 18, 21 h light per day. The best method is to use light tied boxes with lids in continuous light. They are closed for the dark periods. The opening and closing of the lids can also be automatically controlled by a motor via an electric timer.
After (2-) 3 weeks the females are checked for the development of the eggs (the males are easily recognizable by their red testes). Pull with two pointed forceps the abdomen apart and check at a magnification of 25* the egg dotter under a drop of water. The developed ovaries are much larger. It takes about 15 minutes to check 100 flies.
For each record about 200 flies from each culture are needed. Enter the results in a table and plot the values graphically (% diapause as a function of length of light period).
Remark: in italics latin names and references to other entrances in the glossary
|
1 Thanks to D. Engelmann (help with computer work), J. Dittami and P. Reinhard (proofreading), Schneider-Uhle (figures) and students (feedback). This book was typeset by LYX (http://www.lyx.org), a powerful document processor using the LATEX typesetting system.
2All our education is not worth a penny if courage and joy are lost.
3how oscillations are characterized is described on page pageref and illustrated in figure 3.1
4if you do not understand terms, check in the glossary at the end of the book
5words teach, examples bring you forward
6sometimes available in drug stores and gas stations
7The Q 10 value is a measure of the temperature dependency of a process
8if necessary cut out a page of the book to compensate for thickness
9Medline (http://www.biomednet.com), Biological Abstracts, Swets and Zeitlinger with the contents of more then 14000 journals (http://www.swetsnet.nl/direct)
10address: Buchenweg 27, D72820 Sonnenbühl(Germany)
11For this purpose the oscillation is normalized to an evident measure, e.g. to 3600 or 2p circumference of the unit circle or to 24 hours circadiane time. 1800 , p or 12 CT as phase references would all mean, that half of the oscillation has passed.
12there are further procedures for smoothing, in which the values of a smoothing window are weighted; the center value could for instance obtain a high weight, the neighbouring values a smaller weight, and the peripheral values a small weight. Digital filters weight with functions (page pageref)
13supplied by the `CoMet Verlag für Unterrichtssoftware, Duisburg'
14Dr. Diez-Noguera, Group de Cronobiologia, Laboratori de Fisiologia, Facultad de Farmacia, Av. Diagonal 643, SP 08028 BARCELONA (SPANIEN)
15available from the Marutane Trading Co. in Kyoto, Japan
16green fluorescence tubes Philips TL40W/17 covered with green foil nr. 39 Cinemoid
17e.g. plasticine
18If the offset of the recorder is not sufficient, use counter-voltage, to reduce the signal from the amplifier. This allows to switch to a smaller voltage range
19Fa. Stereo Optik, Mainstr. 13, D63128 DIETZENBACH, Tel. 06074 27222
20see study 4.
21substitute of agar from indian plantain-seed pots
22red fluorescence tube with red Cinemoid foil nr. 6, primary red
23e. g. Altromin company
24soot with a candle. Cheap candles make more soot and are in this case to be preferred.
25Philips TL20W/15 with three layers of red Cinemoid foil nr. 6 and one layer of yellow foil nr. 5a.