![]()
![]()
![]()
Visualisation Tools
![]()
Our visualisation tools show the dynamic behaviour of the clock gene network as 2-D or 3-D plots, or in an animated network diagram (example screen shots). Versions are available for the 2-loop (Locke et al, 2005) and 3-loop (Locke et al., 2006) Arabidopsis clock models.
The tools consist of two Matlab m files (Matlab 7 or later required). Download below or from Matlab Central.
For presentation or teaching, you can record the output as .AVI movies: some sample .AVI movies are available here for download. Clock components LHY/TOC1, and X/Y time series are captured showing the transition from LD to LL (9 Mb). These files were created for Windows, but we hope to have Mac and Linux versions available shortly.
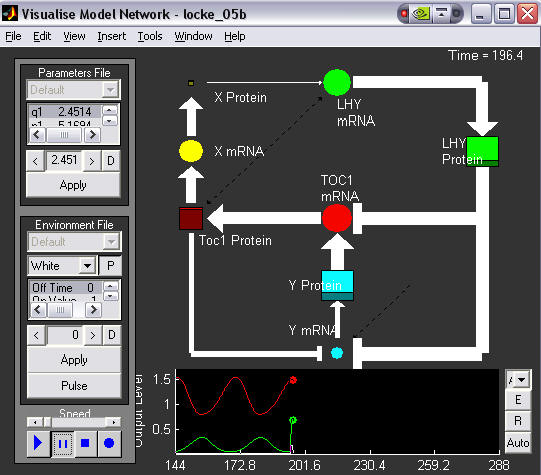
Example screenshot: animated network diagram of the 2-loop clock model oscillating in DD. The user has just applied a light pulse, so LHY has been activated and will soon inhibit TOC1 transcription. Graphs below show mRNA levels.
Download files for the 2-loop Arabidopsis model; 3-loop Arabidopsis model. Each .ZIP archive includes a Readme.txt file describing the installation, and PDF user instructions. Note that you will need Matlab 7 or above to run the programmes!Please email p.e.brown[at]warwick.ac.uk if you experience any problems downloading.
Software on this site is provided free of charge for academic research without guarantees or support either explicit or implied.